3 competitive patterns redefining food delivery marketing
You're managing campaigns, optimizing budgets, and making decisions based on what you can see in your analytics dashboards. But here's the uncomfortable truth: the majority of your customer's journey is currently outside of your view.
And it's costing you.
Key takeaways
1 in 4 food delivery customers (26%) visit multiple brands, actively cross-shopping. For some brands, almost 60% of users also visit competitors.
Competitor campaigns are often invisible to standard analytics—even competitive intelligence platforms—making benchmark data dangerously incomplete.
Brand vs. non-brand search intent differs dramatically by platform, revealing strategic gaps.
The invisible journey problem
As a digital marketer for a food delivery platform, you track conversions, monitor CAC, optimize your paid search campaigns, and measure email open rates. You might feel like you have a good handle on what's working.
But what if 59% of your customers are actively using competitor platforms? What if your assumptions about how people search for your service are wrong? What if the campaign strategy you're betting on is the opposite of what your most successful competitor is doing?
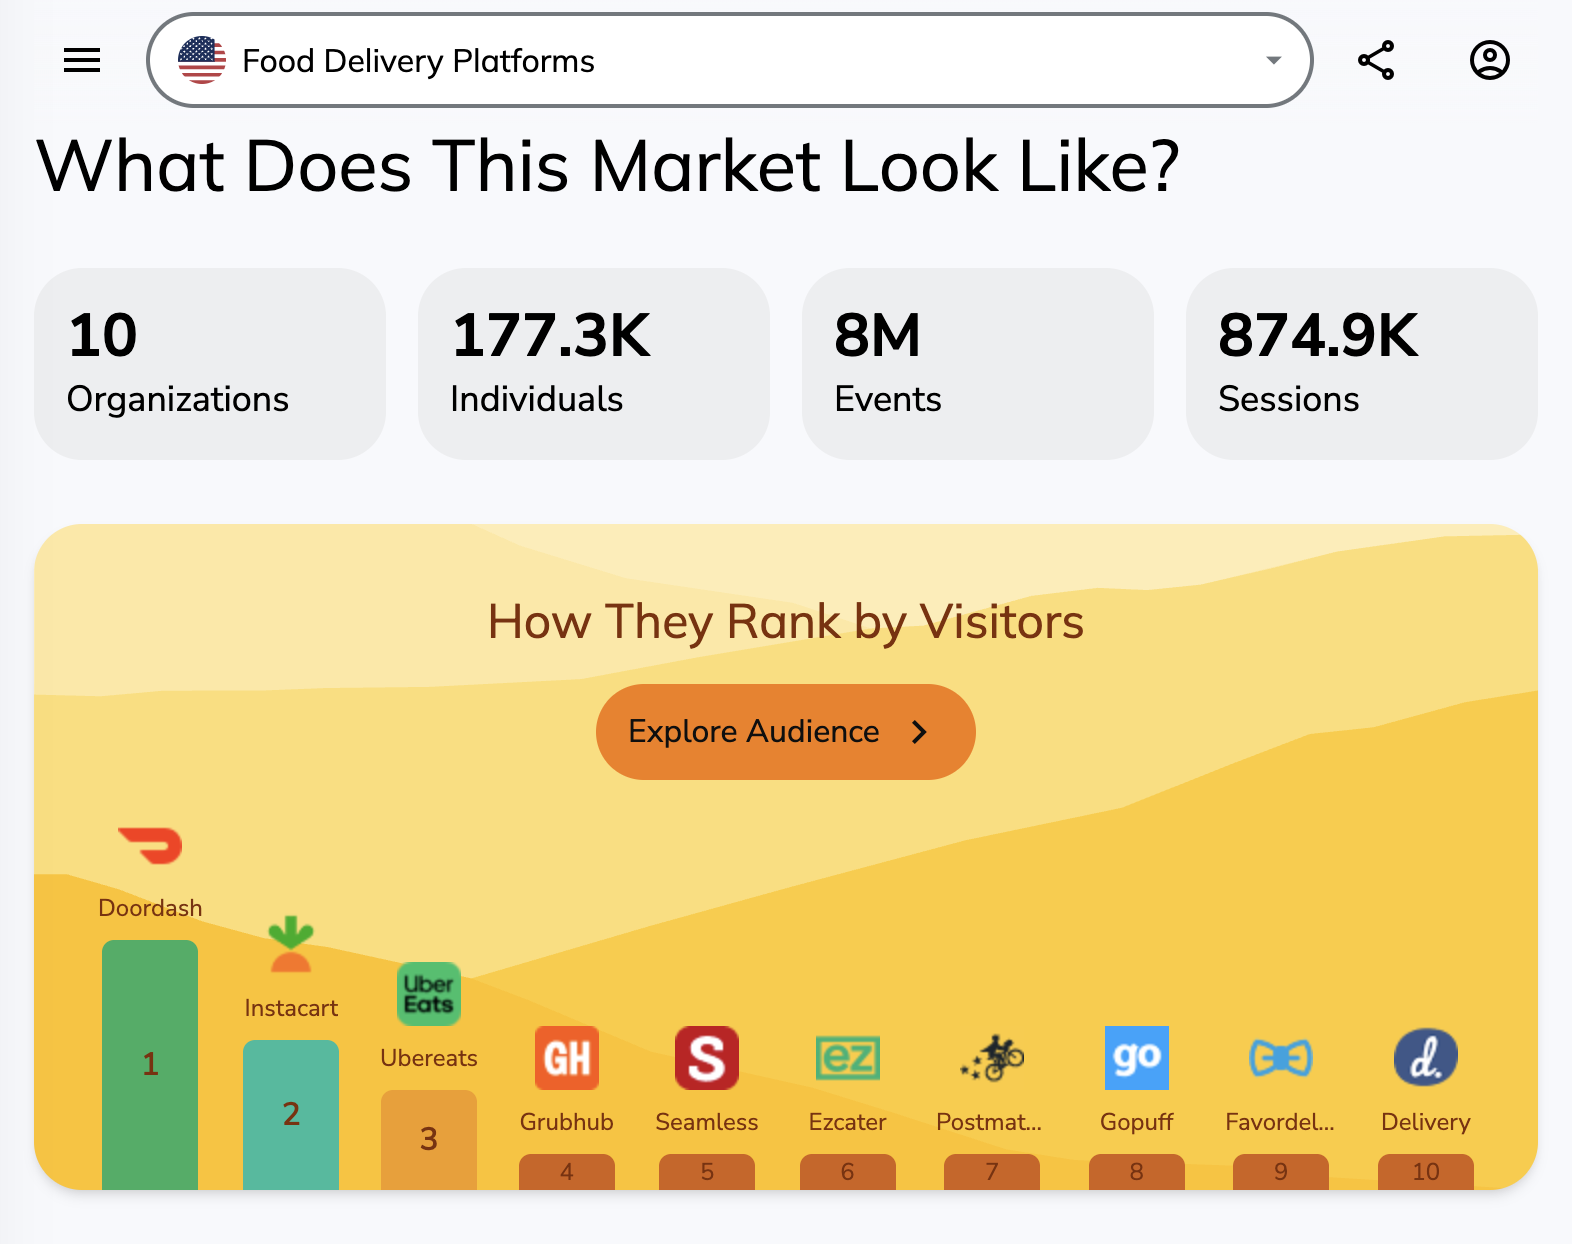
These aren't hypothetical questions. These are patterns happening right now, revealed by analyzing 8 million digital interactions from 177,344 users over 90 days in Q3 2025.
Three patterns that should change your strategy tomorrow
Pattern 1: The multi-platform reality you're ignoring
If you're a marketer at DoorDash, you might assume your 91,568 users are primarily yours. But 38.5% are also active on competitor platforms. For UberEats, that jumps to 52.6%. Grubhub faces the starkest reality with 58.7% of their 31,447 users shopping around.
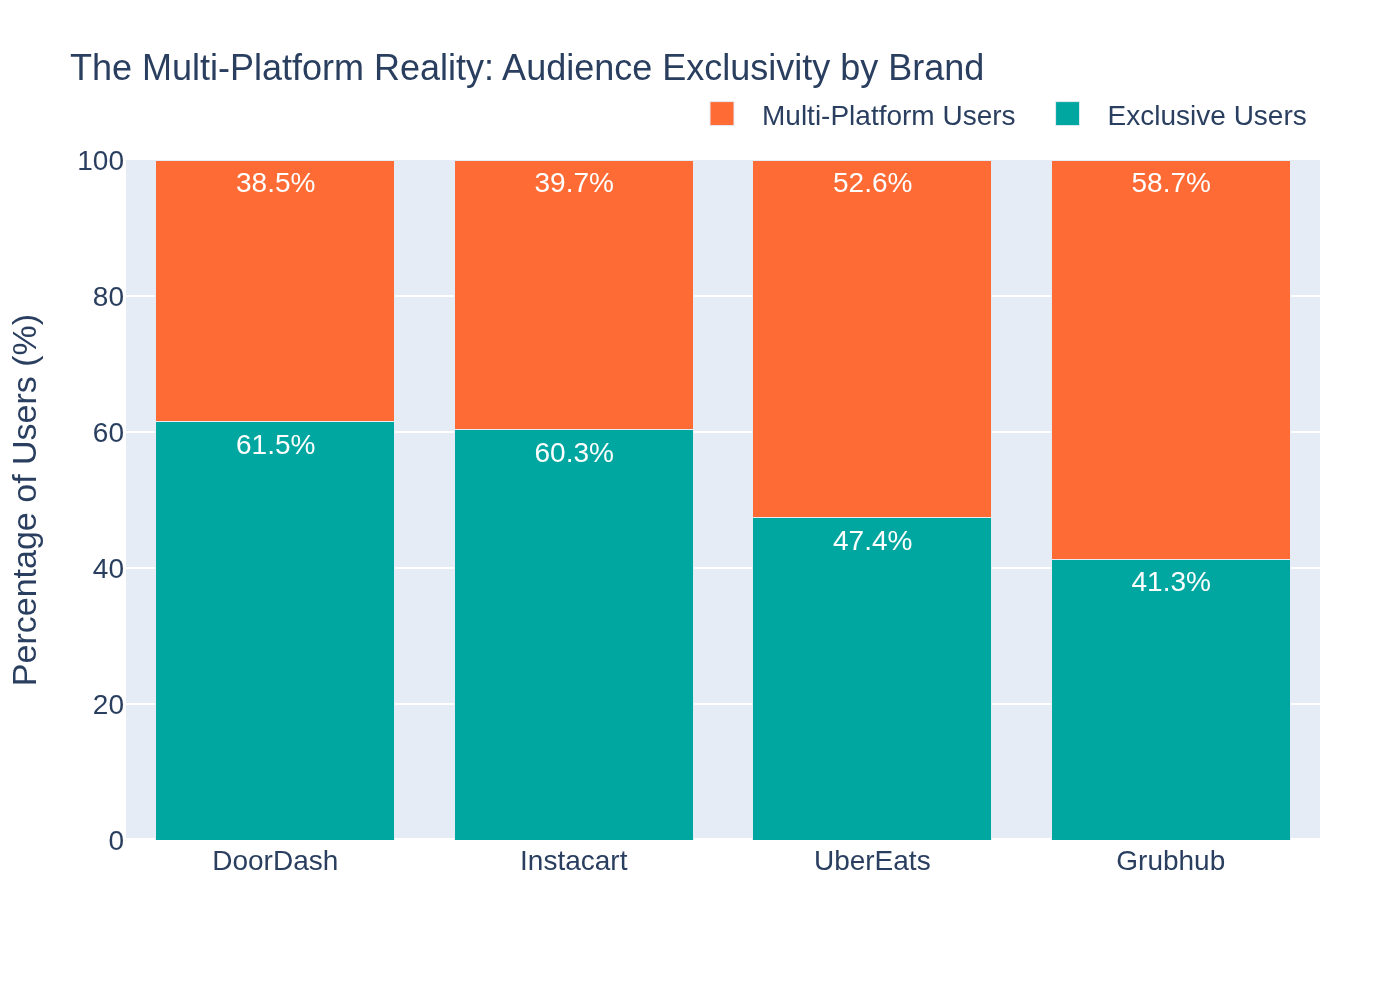
This isn't about loyalty—it's about visibility. You're optimizing for customers who are simultaneously receiving messages from your competitors. Your attribution models are crediting your campaigns for conversions that might have been influenced by a competitor's email or a Google search comparing platforms.
When you can't see that 19% of DoorDash users also visit UberEats, you're making budget decisions without understanding you're fighting for attention in a shared pool.
Pattern 2: Your competitors' campaigns are invisible (even when they're massive)
When you look at campaign execution across major platforms, the strategies couldn't be more different—but there's a bigger problem lurking beneath the surface.
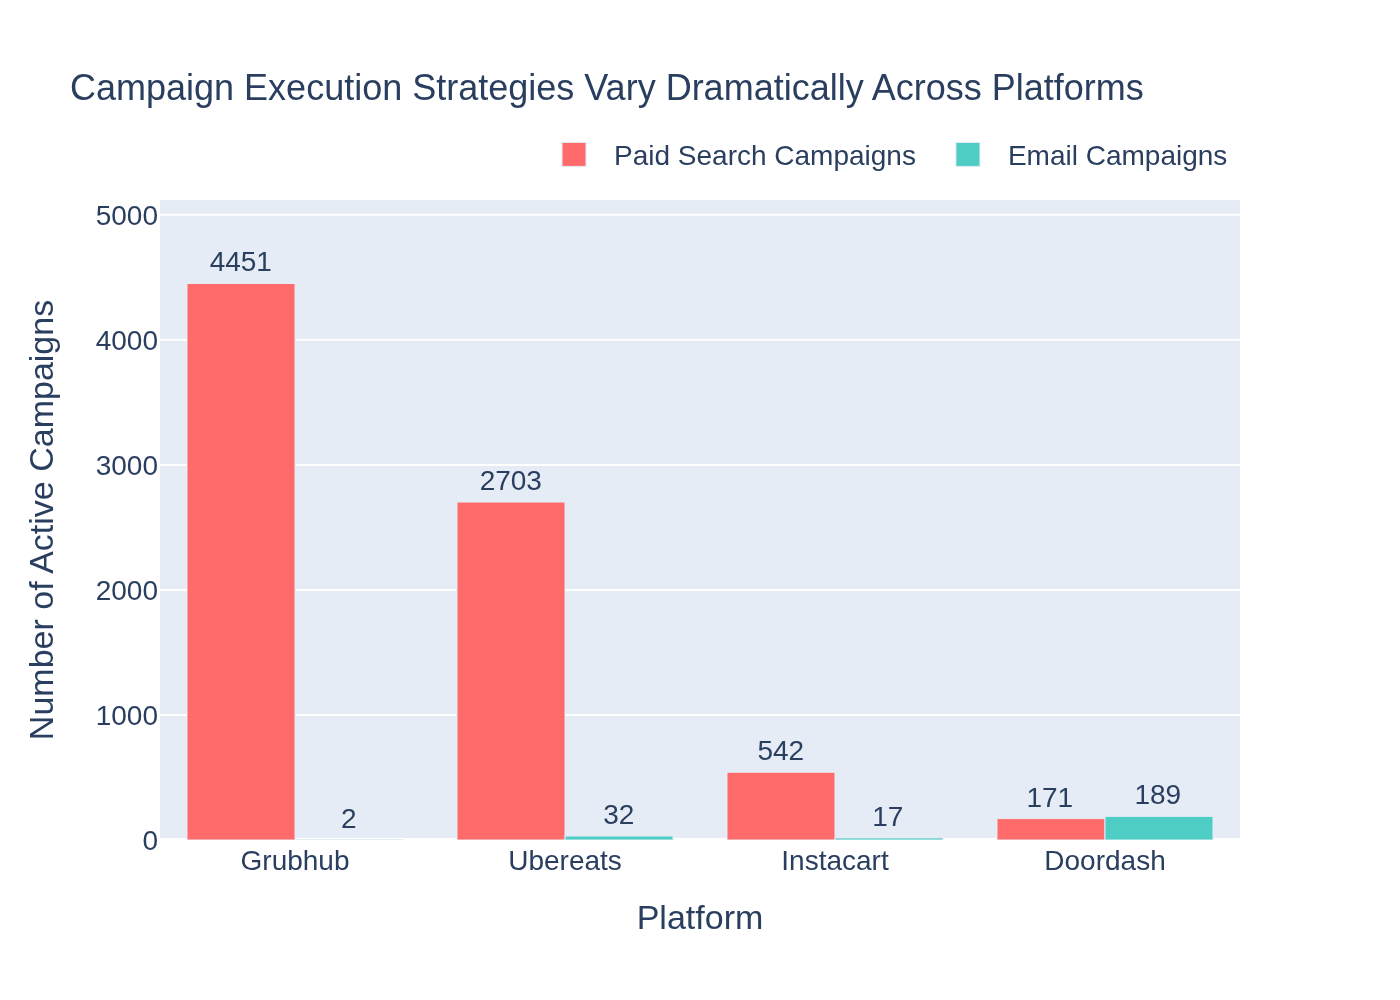
Grubhub runs 4,451 distinct paid search campaigns generating 22,235 events.
Instacart has 542 campaigns driving 23,823 events.
DoorDash runs 171 paid search campaigns with 10,885 events but compensates with 189 email campaigns producing 2,592 events.
But here's what makes this truly interesting: UberEats is running 2,703 paid search campaigns generating 41,142 events—more than any other platform—yet their campaigns would be invisible to most marketing analytics platforms.
Why? UTM tagging inconsistency.
Inconsistent UTM tagging conventions cause confusion in analytics tools
UberEats uses non-standard tagging: they populate utm_source with values like "AdWords_Brand", "AdWords_NonBrand", "Bing_Brand" while leaving utm_medium blank or using custom values like "search-free-nonbrand."
Standard marketing analytics tools look for utm_medium values like "cpc", "ppc", or "sem" to identify paid search. When they scan UberEats' traffic, those 2,703 campaigns show up as "unknown" or "other."
If you're at Instacart benchmarking against UberEats using traditional channel attribution, you'd think they're barely running paid search. You'd be wrong by 2,703 campaigns and 41,142 events.
Competitor strategies vary significantly
Meanwhile, DoorDash has taken a different path entirely: minimal paid search (171 campaigns) but heavy email investment (189 campaigns). Grubhub splits the difference with massive paid search scale (4,451 campaigns) but almost no email presence (just 2 campaigns).
If you're at Instacart seeing Grubhub's paid search volume, should you be scaling up? If you're at DoorDash, are you underinvesting in paid search, or making a smart bet on owned channels? If you're at UberEats, do you realize your campaigns are invisible to anyone trying to understand your strategy?
You can't answer these questions by looking at your own dashboards. You can't even answer them with competitor intelligence tools that rely on standard UTM conventions.
Pattern 3: The search intent gap hiding in plain sight
UberEats receives 81.9% of its search traffic from non-brand queries—people searching for "food delivery near me" or specific cuisine types.
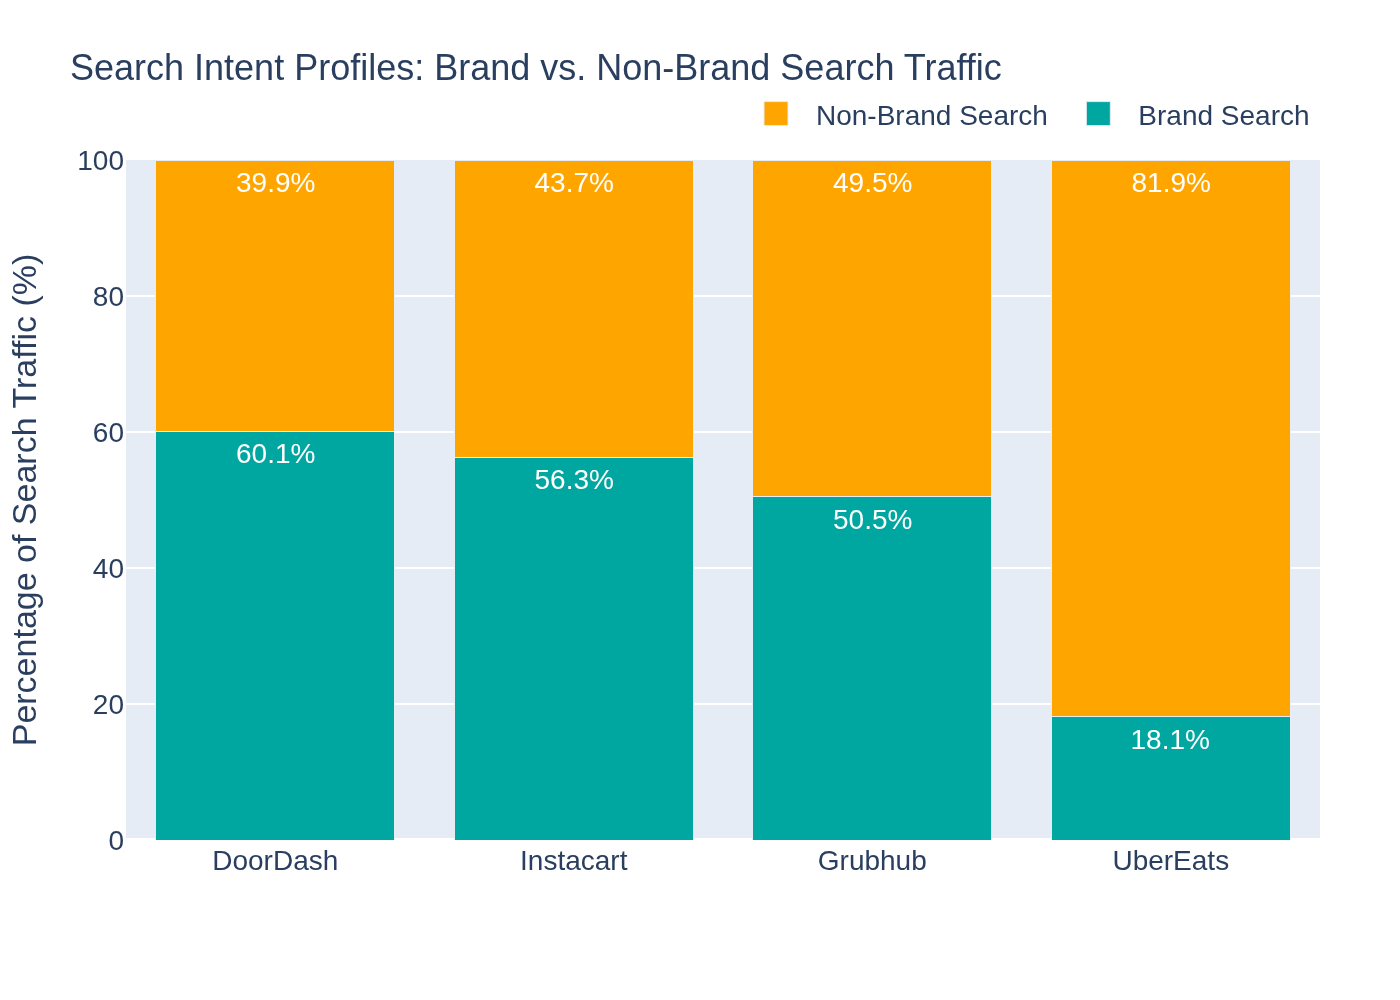
Compare that to DoorDash, where 60.1% of search traffic is branded. These are fundamentally different audiences requiring completely different marketing approaches.
Over the 90-day period, we tracked 182,108 search events across 69,380 unique search terms. The patterns are clear and actionable—if you can see them.
The cost of limited visibility
Every day you operate without understanding the full competitive landscape, you're making expensive guesses:
Setting paid search bids without knowing competitor campaign counts → like how UberEats is running 2,703 campaigns that don't show up in standard tools
Allocating budget without understanding true intent distribution → like why Grubhub runs 4,451 paid search campaigns while DoorDash runs just 171
Measuring success without accounting for multi-platform behavior → like the 38-59% of your users who are multi-platform shoppers
Missing hidden competitor strategies → like the non-standard UTM tagging that makes major UberEats campaigns invisible to benchmarking
Making strategic decisions without knowing a customer's true journey stage → like based on intent distributions (brand vs. non-brand search) without knowing whether you're capturing early-journey traffic or late-stage conversions
Missing partnership opportunities → like the 17,958 referral events DoorDash receives from Capital One Shopping
Your tools were built to show you your data, not the complex market reality your customers live in. And when competitors use non-standard tracking, even competitive intelligence tools miss the full picture.
A different approach: Market intelligence without the data science degree
Journey Insight gives you instant access to see how customers actually move through your entire market. Built on anonymized panel data from millions of real digital journeys, it shows you:
Where your audience overlaps with competitors—and how exclusive your user base really is
What channels and campaign approaches competitors use at scale, regardless of their UTM tagging conventions
How people search for and discover platforms like yours, including brand vs. non-brand intent distribution
What sites people visit before and after engaging with your brand
Which partnerships and referral sources drive meaningful traffic across the market
The tracking and tagging inconsistencies that make competitor activity invisible to standard tools
Journey Insight uses AI for natural language querying. Ask "How does my paid search scale compare to competitors?" and get answers in seconds.
You don't need to become a data scientist. You just need to ask questions—with access to data that includes the 2,703 campaigns your standard tools can't see.
What you can do right now
The data in this post comes from analysis of the US Food Delivery market in Q3 2025—real behavioral data showing what people actually did, including UTM tracking that reveals both standard and non-standard campaign structures.
If you're at DoorDash, investigate why 38.5% of your users visit competitors, and whether your email-heavy approach (189 campaigns) breaks through in a multi-platform environment where UberEats runs 2,703 paid search campaigns.
If you're at UberEats, audit your UTM tagging strategy. Your 2,703 paid search campaigns generating 41,142 events are invisible to standard analytics—including possibly your own attribution reporting. Your 81.9% non-brand search composition suggests you're capturing people earlier in their journey, but can you measure it properly?
If you're at Instacart or Grubhub, wildly different campaign counts (542 vs. 4,451 paid search campaigns) suggest different philosophies about scale vs. focus. Understanding which approach correlates with engagement and exclusivity could reshape your entire strategy.
Take the next step
Journey Insight offers a robust free plan that gives you access to market-level intelligence for your industry—including the ability to see competitor campaigns that use non-standard tracking conventions.
Sign up for free to see what your customers and competitors are really doing.
Try one of these AI prompts in Journey Insight
Show me the referral sources driving traffic to the top platforms in my market and identify partnership opportunities I might be missing.
Compare UTM tagging patterns across competitors and show me where non-standard conventions might be hiding campaign activity.
Analyze the journey paths two steps before and after visits to my platform to understand where users come from and where they go next.
Your customers have changed. Your competitors are running campaigns you can't see. It's time to change your approach to understanding them.
Get free insights on your customer journeys
Sign up for our robust Free Plan in just a few minutes.
About the data | US Food Delivery Platforms, Q3 2025
All insights are based on anonymized behavioral data from 177,344 users generating 8,004,400 market events across 10 food delivery organizations during a 90-day period (July 1 - September 30, 2025).
Campaign analysis includes 182,108 search events across 69,380 unique search terms, and 363,199 UTM-tagged events across 8,601 unique campaigns. Analysis performed using Alterian Journey Insight.
See the latest journey insights
Hospitality brands can't see 85% of the customer journey
Travel & leisure analytics only show 15% of the customer journey. See how travelers move across OTAs and competitors—and how Journey Insight reveals what your dashboards can't.
How AI has changed customer journeys (and why most brands can't see it)
AI tools like ChatGPT are reshaping how customers discover brands. Learn why most journeys are invisible—and how market-wide insight changes strategy for GEO.
GEO isn't just SEO for AI—it's a competitive strategy
Generative Engine Optimization (GEO) goes beyond SEO for AI. Learn how AI reshapes customer journeys, comparison, and competitive strategy.